Figure 11. Click detection with making the absolute value
of the backward derivation of the signal.
Digital techniques were already used in 1970. For example, in that time engineers did channel equalization on old Caruso records [12]. The subject came again into foreground when the Compact Disc appeared and sound engineers wanted to archive the old sound-recordings.
First, sound-engineers restore the record physically, then they digitize the sound with a high quality record-player and a digitizer. Then digital noise reduction techniques will be applied.
More different algorithms are used together. Special algorithms used for click reduction and other algorithms for hiss reduction. Several algorithms are developed. Unfortunately we cannot discuss these algorithms in details, because they are too difficult and the main reason is that they are secrets. I can show only the basics of these algorithms.
Click detection
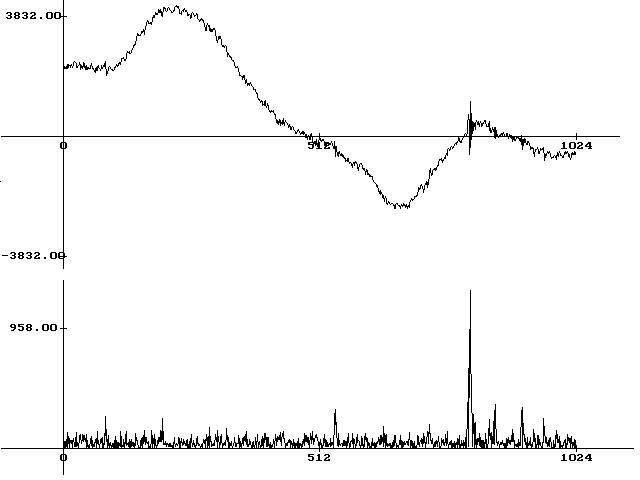
As we could see in the second chapter, clicks and cracklings are short time impulsive disturbances. The shape of each impulse is different. The only common attribute is the starting impulse. This impulse has a wide spectrum with high amplitude high frequency components. We can identify these components with a high-pass digital filter. Difficult filters are not too efficient, because every filter has own transients. These transients can cover the transient of the click impulse. Robust IIR or simple FIR filters are recommended. In my experiments the simplest FIR filter: the backward derivation gave the best results. This result can be seen in figure 11. On the upper part the original signal can be seen. The lower part is the absolute value is the transformed signal of the backward derivation of the original one. The click at the 800th sample caused a big peak in the lower signal that can be easily identified.
Figure 11. Click detection with making the absolute value
of the backward derivation of the signal.
For this identification, we must choose a comparation level on the transformed signal. This comparation level cannot be constant because the optimal value is the function of the amplitude of the sound.
We have to identify the begin and the end part of the click. This can be made by a second comparation around the detected click samples by a new comparation level.
Elimination of clicks
The second step of click reduction is the elimination. We must replace the click samples with new ones and we don't have to change other samples. Unfortunately we don't know what was the original signal at the click, but we can make estimations that will give an enjoyable sound without click-like effects.
One estimation method is the median-filtering. Median-filter is an ordered statistical filter. These filters use a filter window. They put the samples in the window in increasing order and they choose one sample that will be the output of the filter. Then they go further with one sample, put in order the new samples and give another output and so on. At median-filters, the output value is the median-value. With this filter the impulsive disturbance samples (that are far from the median value) will fall out.
The problem with this filtering, that the repaired sound part will not contain any high frequency sound. We can estimate these high frequencies for example from the earlier samples. Let us make the median filtered version of this part, too. Subtract this version from the original part. The result will be a high frequency signal that will be good for high-pitched sound estimation. If we add this signal to the median filtered click, we will get good sound part estimation. This method can be seen in figure 12. The results can be seen in figure 13.
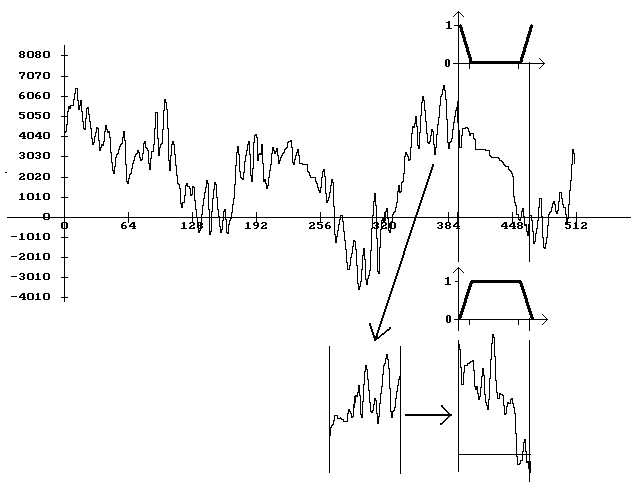
Figure 12. Click reduction with median-filtering and high spectrum
estimation
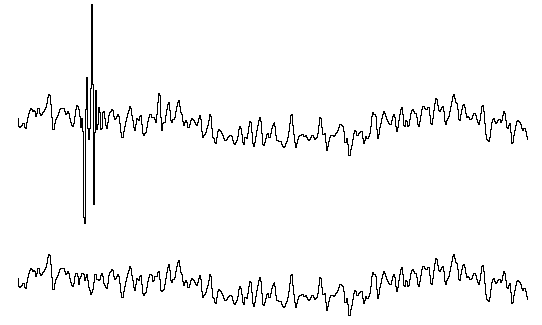
Figure 13. Results of click reduction. The upper signal is the original
one
with a big click at the begin part. The lower is the restored signal.
This algorithm is not a very difficult one and it can run fast.
Hiss reduction
Hiss reduction requires completely different algorithms. Hiss is not a short, impulsive disturbance. It is always on the useful signal.
The hiss has a nearly constant spectrum. If we can "subtract" the noise spectrum from the original spectrum somehow, we will get the cleaned signal. First we have to make an estimate for the noise. This estimate can be the estimate of the power-density spectrum, the periodogram. The periodogram is the amplitude spectrum of a noise part. Unfortunately, the frequency components of the periodogram has very high variance (the relative variance is 100 %). This variance can be reduced by averaging of some periodograms (that is the Welch-method or modified Welch-method [14]).
The next step is the "subtraction". We must subtract the noise spectrum estimation from the spectrum of the sound-parts. This is not a simple subtraction, because that can cause negative amplitude values in the result that is impossible. If the amplitude would be negative after subtraction, let replace that with zero. This algorithm is called soft-elbow algorithm. Another algorithm, when we don't change every spectrum-lines, only we replace the spectrum-lines with zero, which are smaller than the spectrum-line of the noise-estimate. This algorithm is called hard-elbow. The soft-elbow algorithm can reduce effectively the noise, but the remained sound could be "burbly" or metallic. The hard-elbow algorithm has smaller distortion, but it is less effective than the other one.
A flow-chart diagram of the basic hiss-reduction algorithm can be seen in figure 14. The "?" marked box contains the hard- or soft-elbow algorithm.
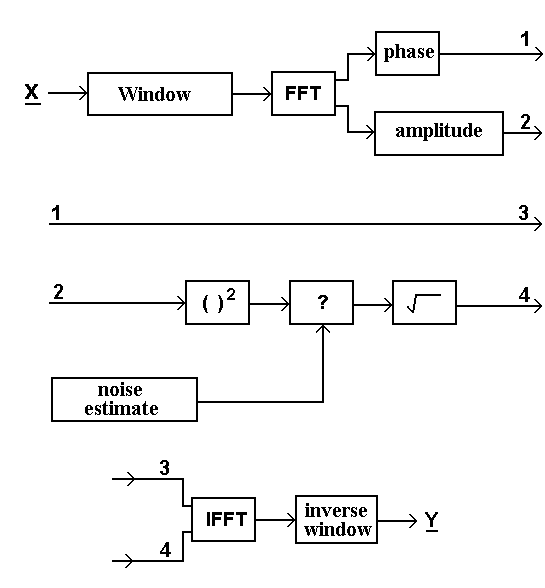
Figure 14. Flow-chart of hiss reduction.
Back to Table of contents - Back to previous part - Next part