
The application of the cine camera for scientific investigation of motion is ascribed to the French physiologist E-J Marey. Marey demonstrated his so called chronophotographic box in 1888 by recording movement of humans and animals. He obtained characteristic and traceable patterns by identifying the anatomical landmark points with contrasting markers. Inspection, and later geometrical and numerical analysis, was performed on the film records of the markers in motion. The use of markings by lines, not dots, along trunk and limbs led to the typical stick diagrams representing the figure in motion.
In the principles of using markers in motion studies not much has changed in the enduing century of cine film analysis, which as a basic tool has pervaded so many segments of biomedical, sports and industrial research and applications. The marker-based and image-based motion analysis requires the following steps:
In this paper a summary of passive marker based motion analysis is given and a representative related device, the PRIMAS analyser is described. Two biomedical applications demonstrate the effectiveness and applicability of marker based motion analysis. The crucial decisions related to these applications serve as guidelines for prospective users.
In marker based motion analysis markers are attached to landmark points of the moving objects. This makes a very effective, hardware supported data reduction possible in image based motion analysis. Appropriately illuminated markers result in bright spots on the camera sensor and these can be extracted by thresholding the video output signal of the camera. This is illustrated in Fig. 1.

The movement of the objects are described by the trajectories of landmark points, where markers are attached to. During the analysis these markers are tracked by CCD cameras. The marker image on a CCD sensor is the two-dimensional projection of a marker. The markers are spheres or circular disks, so that their projection is a circle on the CCD sensor. The position of a marker is characterised by its centre co-ordinates. The 2D co-ordinates of the centre of a marker image are computed by processing the digitised marker image. The 3D co-ordinates can be determined on the basis of at least two 2D co-ordinates belonging to the marker images (taken by different cameras) of the same marker. Figure 2 summarises this elementary signal processing.

Resolution and accuracy
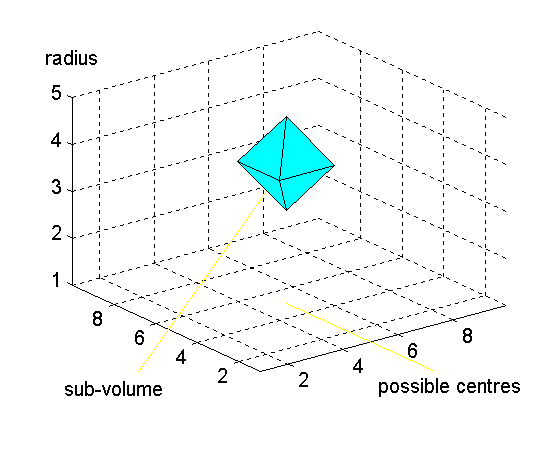
The marker ® marker image ® digitised marker image projection is unique. A fixed marker - camera position fully determines the marker image and if the threshold level is given it determines the binary marker image as well. In image based motion analysis data processing is performed in the inverse direction. The binary marker image is available, it might be caused by different marker images, as a result of quantisation. All the possible circular images can be represented in a 3 dimensional space, where the horizontal plane stands for the centre and the vertical axis for the radius. In this volume a sub-volume belongs to each binary marker image, one sub-volume is shown in Fig. 3. The resolution, supposing ideal circular marker images, was studied by simulation [3, 4].
A marker image, seen by a single camera determines only a straight line in the observed space, the marker can be anywhere along this line. (As a result of quantisation the line widens to a cone.) If two or more cameras see the same marker then its position can be computed in 3D as the intersection of the straight lines determined by the cameras.
The resolution and accuracy strongly depend on the size of the marker image. Resolution and accuracy can be increased by increasing the marker image size. This can be achieved by applying greater markers or by decreasing the field of view. We measured the 2D accuracy of PRIMAS (see paragraph 3). The measured value of the marker position cannot be compared to a known value because the real position of the marker centre cannot be easily determined with another more accurate method. The accuracy was measured by moving a saddle along a rod. A marker was fixed to the saddle, the centre co-ordinates of the marker were computed in a great number of positions. A straight line was fitted (with least squares method) to the computed centre co-ordinates. The deviation of the computed centres from the fitted line are shown in Fig. 4. The average deviation is 0.0458 with a standard deviation of 0.0325, both expressed in pixel side. For the vertical accuracy it means an average of 1:6300 and a worst case of 1:2000. The marker was moved horizontally, nearly parallel with the horizontal side of the field of view. The marker image covered 18 lines on the CCD sensor. The CCD sensor has 288 lines and 604 columns and operates in non-interlaced mode.
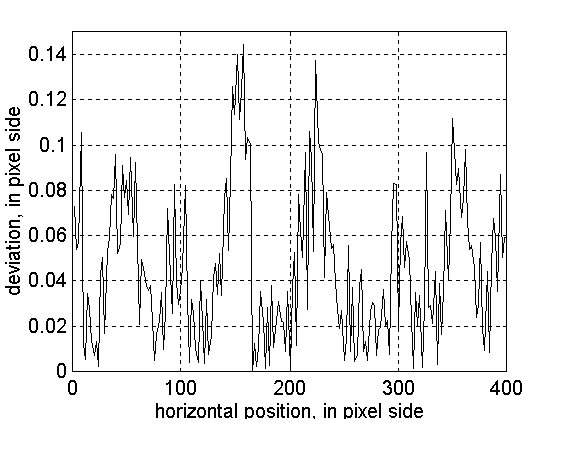
The accuracy measurement was repeated modifying the direction of the marker movement. The vertical movement resulted in approximately the same accuracy. This characterises the accuracy during the neurological application detailed in chapter 6 as the marker movements are mainly vertical. During the third experiment to assess accuracy the rod was placed so that the marker image moved diagonally within the field of view. In this case the accuracy markedly decreased, the worst peaks reached 18 % of the pixel sides. As described in this chapter the accuracy of image based motion analysis cannot be specified with one simple parameter. In each application, we measured the corresponding accuracy using the method described here.
The PRIMAS Precision Image-based Motion Analysis System uses the video/digital conversion method developed at Delft University of Technology [1]. The analogue video signal from each camera is fed to a comparator with an adjustable threshold voltage, to produce binary or above-threshold video which expresses and is limited to the marker images. The video-digital co-ordinate converter consists of digital counters, one for line number Y and one for column number X. These are fully synchronous with the main system controller that synchronises the cameras down to the pixel clock level. The instant read-out of the running X, Y counters at the binary video transitions produces the digital X, Y co-ordinate values at the imaged marker contour points on the pixel grid. The marker contour co-ordinates for each camera are buffered and subsequently processed in the marker centre estimator subsystem. The objectives of marker centre estimation are further real-time data reduction and subpixel definition of the centre co-ordinates of markers which are imaged across several lines of the pixel grid [ 2] . The methods are geometric centroid estimation, which in real-time is fully operational with the current PRIMAS system, and circle fitting by estimating the centre co-ordinates and radius. Experimental real-time circle fitting is a little slower. Ring fitting [ 3, 4] gives higher accuracy if the number of average size markers does not exceed 4. From the marker centre estimator, the co-ordinate output data are interfaced to the host PC. The two-way interface also links the PC to the PRIMAS system for menu-driven control of cameras, thresholds and other hardware options. PRIMAS is a passive marker based motion analyser, several commercially available systems have been derived from it (e.g. VICON [ 5] , ELITE [ 6] , CINTEL [7]). The sampling rate of the analyser is high (100 full frames per second) and it has good resolution, 1 : 6000 compared to the corresponding side of the field of view both horizontally and vertically with small (4 - 6 lines high) marker images. The low-level image processing programs aid the later identification of markers. Not only the centre co-ordinates but also the size of the marker images is calculated and this information is transferred on user request in real-time to the operator PC. The size information is useful if marker images are distorted or occluded in a frame.
Post processing programs of PRIMAS include automatic marker tracking and estimation of missing marker trajectories allowing user intervention. Also off-line filtering of trajectories is possible. This suppresses the quantisation noise. The system has a very simple though effective 3D calibration method, based on the SMAC procedure [8, 9].
The Dutch developers/researchers have also reported on several biomedical applications: gait analysis, arm motion studies, prosthesis evaluation, rehabilitation, focal dystonia analysis, mandibular motion analysis, locomotion studies in the cat [2]. Further details can be found in [ 10] .
Our projects are classical research projects as neither the measurement technology nor the necessary signal processing is known in advance. The aim of the research work is to define
· an examination procedure based on human movement analysis to recognise the Parkinsonís disease in the early phase.
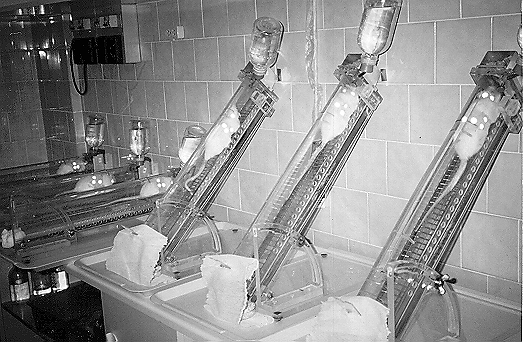
In the Experimental Research Department - Second Institute of Physiology, Semmelweis University of Medicine, Budapest, special tubelike cages were developed and constructed to study the chronic adaptation of the vascular system of rats to static load. The cages are tilted by 45° . The rats are in head-up position and they can move back and forth and turn around the longitudinal axis of their trunk freely but they cannot turn to head-down position. The gravitational load results in characteristic adaptive changes in the capillary density of muscles of the hind limb and in the biomechanics of the veins [11]. In order to promote the integrative physiological interpretation of the effects it is necessary to continuously track and record the quantity and pattern of somatomotoric movement of the animals for several days.
The aim of our analysis was
One frame was taken in each second resulting in a total of 160 Mbytes of raw data. (Not all the markers are always seen by the cameras.)
The raw data was processed to extract the above parameters. Figure 6 shows the position along the tube as a function of time for a rat in a horizontal cage (top curve) and in a tilted cage (middle). The bottom curve is the output of a light-sensor, low values stand for low light. Figures 6 and 7 show a 45 hour period at the beginning of the recording.
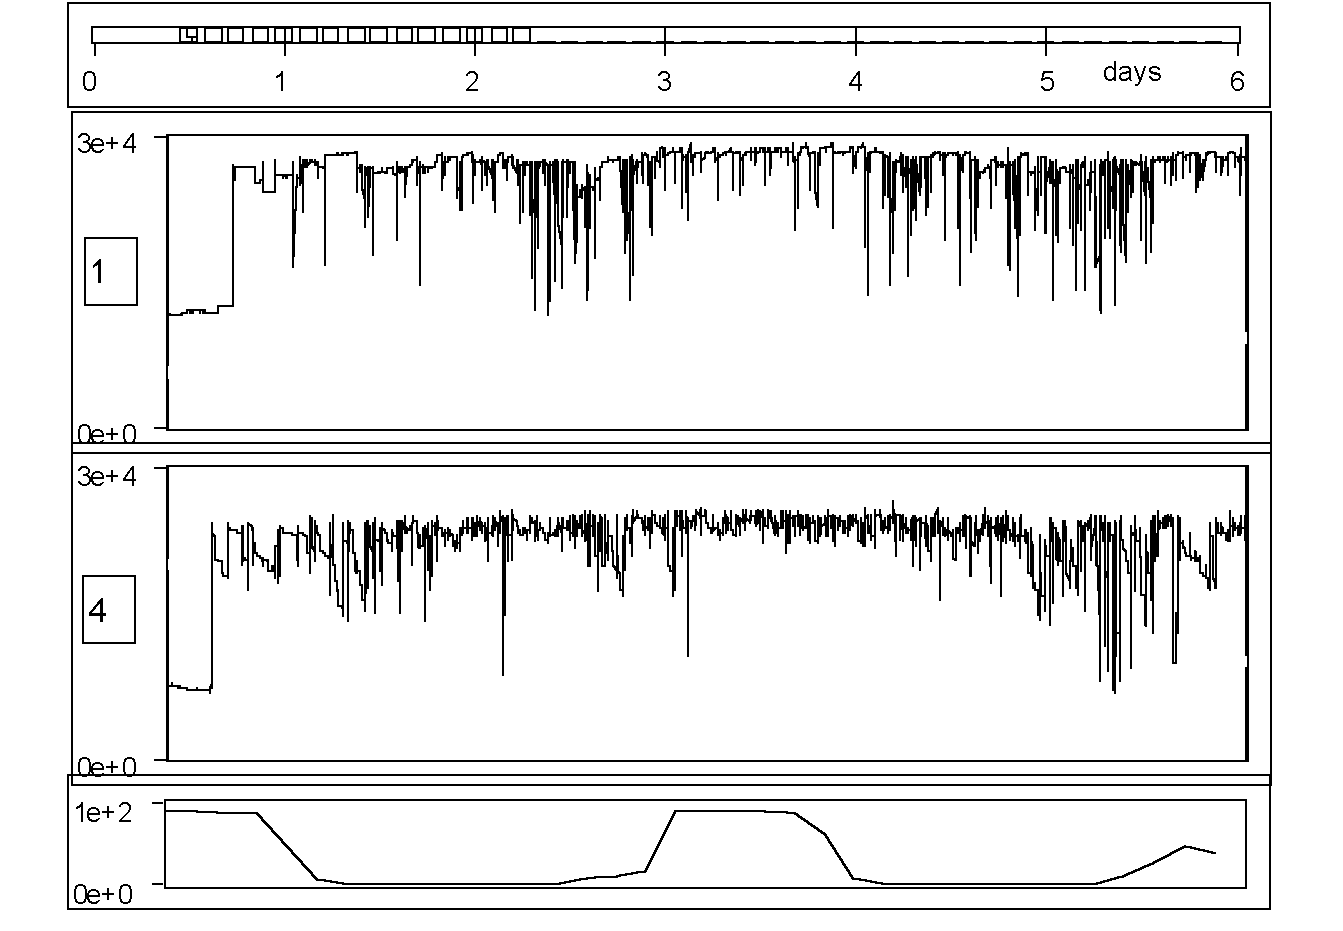
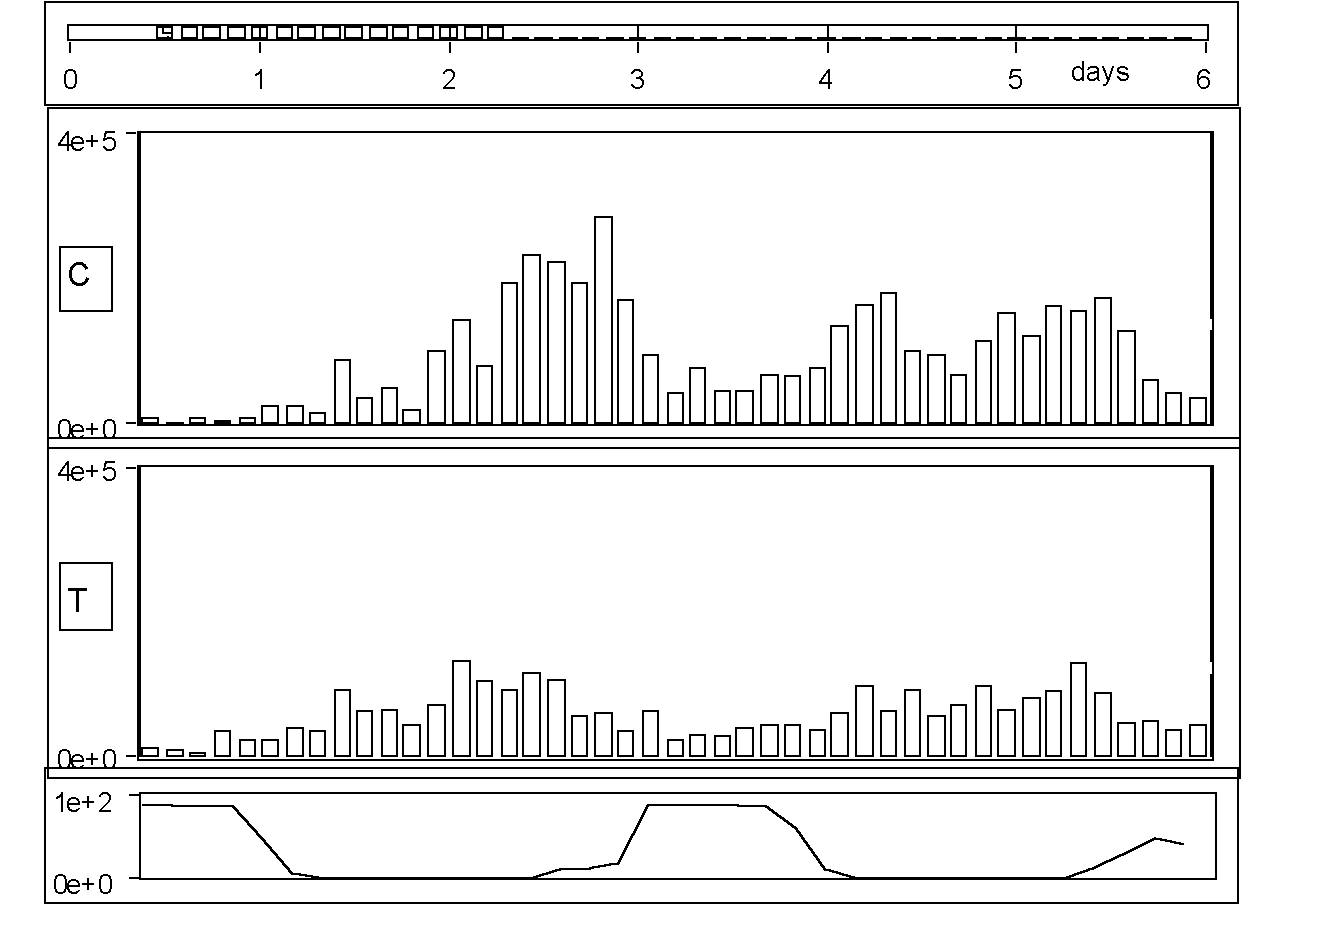
On the basis of the position-time functions, one statement can easily be justified: the activity of a rat is much higher at night than in daytime, and this pattern is not influenced substantially by tilting. We integrated the total distance covered by each rat during the experiment. The total displacement is nearly twice as high for the rats kept in the horizontal tubes than that of rats in the tilted tubes. Consequently, this integral feature is suitable to characterise the difference in the movement activity of the two groups. Figure 7 shows average displacement values, each bar is proportional to the average of the distances, covered by the 3 rats in a group during an hour. The top curve is for the control group (kept in horizontal tubes) and the middle curve is for the rats in the tilted tubes. The difference in activity between the two groups is substantially higher at night.
The following problems occurred during our experiments.
The symptoms of a neurological disease, the shaking palsy, were described by the English surgeon James Parkinson in 1817. Two characteristic symptoms are movement related, the tremor at rest and the muscle rigidity. The features of the disease are summarised in [12] and a widely accepted scale of the severity of the disease is given in [13]. The diagnosis of the disease is complicated by the fact that other neurological diseases have similar symptoms. The aim of this application is to develop a method
The early detection of the disease increases the efficiency of the therapy and medication. The objective measurement of the actual state of a Parkinsonian patient helps the neurologist adjust the treatment. The research plan concentrates on two main parts: examination methodology and feature extraction, including signal processing. The examination methodology requires the definition of
The movement patterns must be simple to allow short examination time. This is decisive if the early detection is supposed to be done in the frame of a screening test. The examination must give reproducible results, this requires the exact definition of camera arrangement as well. If the movement patterns can be recorded using a single camera in a single position then no rearrangement of the analyser is needed thus assuring minimum examination time. However this means that the field of view should be selected to be big enough for all the movement patterns. This prevents us from using the minimal field of view to each movement that would be advantageous regarding resolution and accuracy. It was possible to achieve sufficient accuracy using the same camera position for all recorded movements. The movement patterns to be analysed were specified by neurologists. There are widely used patterns that are evaluated visually in the daily routine, these were the initial movement patterns in our experiments:
b.) complex patterns: hand waving during gait, turning the head during gait.
The determination of these parameters means a feature extraction, its aim is to characterise the movement of a patient with a few parameters only. The results gave a feedback for the definition of movement patterns to be analysed. Based on the experiences drawn from the recordings, only hand- and finger movements were selected. These allow the definition of one camera position for all movements. Furthermore, these movements can effectively be characterised in 2D thus a single camera is enough to make the recordings. A simpler - and cheaper - analyser will certainly be able to fulfil these requirements promoting the introduction of the method as a screening test.
The following finger- and hand movements belong to the test:
Tapping test: The subject puts his/her hands on the table. Markers are 8 mm diameter spheres, attached by rubber stripes to the middle phalanxes of the fingers, except the thumbs. Subjects are asked to raise 8 of their fingers (thumbs remain on the table) and then hit the table with their fingers in the following order: small, ring, middle and index finger. They are asked to perform the movement symmetrically with both of their hands, and as fast as they can.
Twiddling: Subjects are asked to perform this movement in front of their trunks as fast as they can. Their hands are in nearly horizontal position, 30 mm diameter markers are on their forearms, 15 cm far from their carpal bones.
Pinching and circling: This movement is performed in 6 phases. The 4 single hand movements are: pinching with the right hand, pinching with the left hand, circling with the right hand, circling with the left hand. There are 2 complex movements: pinching with the right hand and circling with the left hand and pinching with the left hand and circling with the right hand. Markers with 8 mm diameter are attached to the middle phalanxes of the index fingers and to the thumb of the pinching hand.
Pinching movement: the forearm is in vertical position little- ring- and middle fingers touch the palm. The subject moves his/her index finger: touches the thumb, then lifts the index finger and then touches the thumb again.
Circling movement: the forearm is in horizontal position, the index finger is stretched. The forearm circles around the superficies of an imaginary cone, the elbow is supposed to remain in nearly the same position.
Three groups were tested: 13 young healthy subjects, 10 senior healthy subjects and 6 Parkinsonians. All recordings lasted for 8 seconds, the sampling frequency of PRIMAS was set to 100 frames/s, resulting in 800 frames for a recording. Figures 8-10 show parts of the recorded movement patterns. In the overwhelming majority of cases all the markers were identified and their centre co-ordinates computed by PRIMAS. However, there were some frames with split marker images and also some ghost markers appeared. These were eliminated with the Primasys off-line post-processing program. On a few frames markers were missing because they were occluded. The first step in the application specific data processing was the completion of the trajectories. This was done by linear estimation of the missing part. The longest missing part comprised 3 marker positions, on 3 consecutive frames.
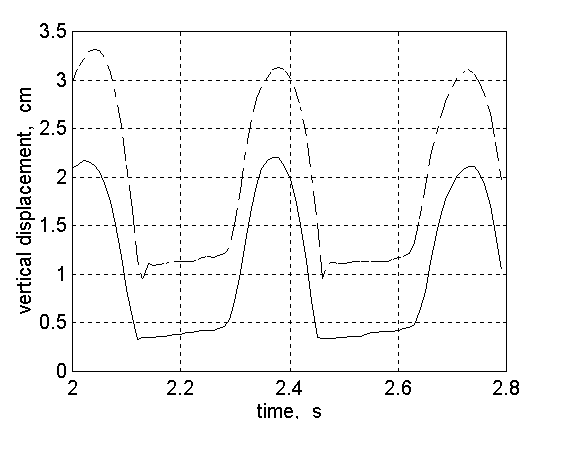
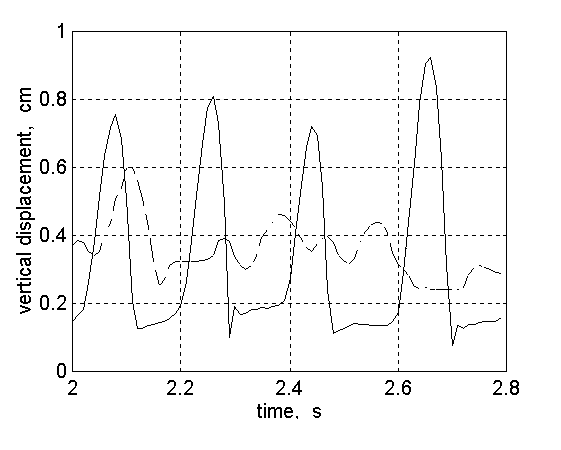
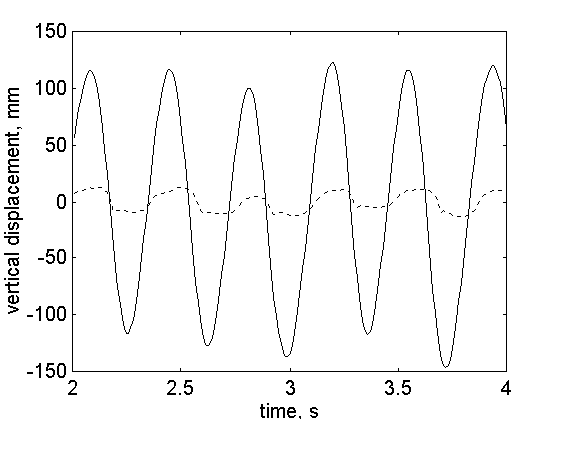
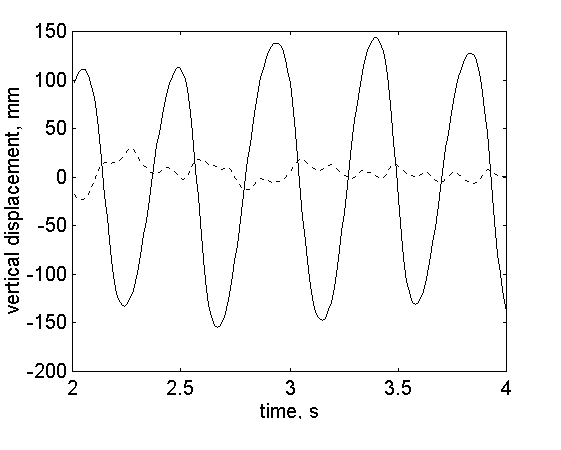
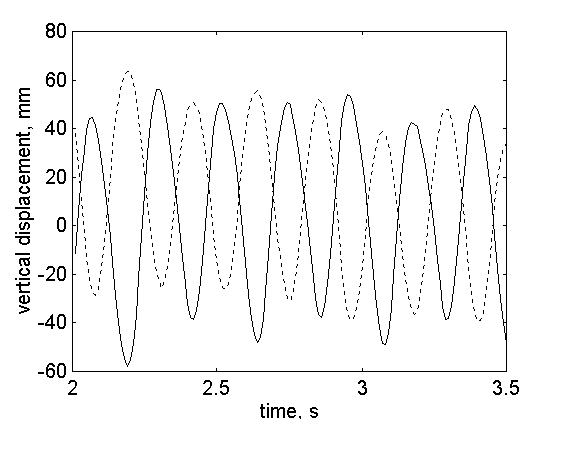
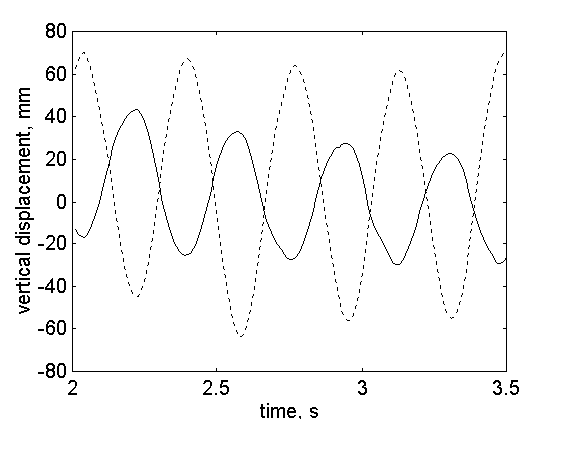
The corrected position-time functions were processed with MATLAB. The results of signal processing are detailed in [14, 15]. Parameters were defined that characterise the symmetry and co-ordination of movements. A combined parameter expresses the level of suspicion, that the tested subject is affected by the disease. The early detection aims at revealing subtle deviations from normal. As an example, one parameter characterising the tapping test is the difference between the time intervals computed for the two hands from the level contact of the ring finger to the level contact of the index finger. Three conditions must be met before this parameter is calculated. (1) the movement of all the 8 fingers must be quasi-periodic, there must be a dominant frequency for all the 8 fingers. (2) The dominant frequencies of the 4-4 fingers on both hands must be close enough to each other. (3) The dominant frequencies of the two hands must be close enough to each other. When these conditions are not met, this movement pattern is not evaluated further, the suspicion is set that the subject is affected by the disease. However, when the aim is to characterise the actual state of a patient known to be Parkinsonian then the evaluation is not terminated though certainly the above conditions are not met. The measure of deviation from normal should be expressed in this case. Several tests were reported for qualifying the deterioration of movement patterns of patients known to be Parkinsonians, e.g. [16-18]. Our method is pioneering as a screening test, when the state of the patient is unknown and the suspicion of the disease is aroused or rejected based on the analysis of the movement patterns.
The research work was partly sponsored by the COPERNICUS project PRIMAS.EC, nr.7845 and of the OTKA (Hungarian National Science Fund) project nr. T 023125.
[2] Furnée, E. H., TV/Computer Motion Analysis Systems: The First Two Decades. PhD Thesis, Oct. 1989. Delft University of Technology, ISBN 90-9003095-6. (1989)
[3] Jobbágy, Á., Centre Estimation in Marker Based Motion Analysis. Technical report of Technical University of Budapest, ISBN 963-421-509-2. (1993)
[4] Jobbágy, Á. and Furnée, E.H., Marker centre estimation algorithms in CCD camera based motion analysis. Med. & Biol. Eng. & Comput., 32, 85-91. (1994)
[5] Kepple, T. , Stanhope, S.J. and Rich, A.H., The Presentation and Evaluation of a video based six degree of freedom approach for analyzing human motion. In: Proc. IEEE/EMBS 10th Ann. Int. Conf., CH 2566-8-88. 649-650. (1988)
[6] Ferrigno, G. and Pedotti, A., ELITE: A Digital Dedicated Hardware System for Movement Analysis via Real-time TV Signal Processing. IEEE Tr. on Computers, vol. BME - 32, 943-950. (1985)
[7] Dinn, D.F., Winter, D.A., Trenholm, B.G., CINTEL - Computer Interface for Television. IEEE Tr. on Computers, 1091-1095. (1970)
[8] Woltring, H.J., Planar control in Multicamera Calibration for 3D Gait Studies. J. Biomechanics, Vol. 13. 39-48. (1990)
[9] Sabel, J.C., Implementation of SMAC in a 3D Motion Analysis System. In: Macellari, V. and Torre, M. (eds.) Proc. of the Workshop: Experience and New Programs. Rome, Dipartimento di Elettronica e Automatica, Ancona, 153-158. (1990)
[10] E.H.Furnée and Á.Jobbágy, Precision 3-D Motion Analysis System For Real-time Applications. Microprocessors and Microsystems, Vol.17., Nr.4. May 223-231. (1993)
[11] Monos, E. et al., Effect of long-term tilt on mechanical and electrical properties of rat saphenous vein Am. J. Physiol. 256: H1185-1191. (1989)
[12] Selby, G., Parkinsonís Disease. In: Chapter 6. of Handbook of Clinical Neurology, Vol. 6. Diseases of the Basal Ganglia. North-Holland Publishing Co., Amsterdam, 186-207. (1968)
[13] Hoehn, M.M. and Yahr, M.D., Parkinsonism: Onset, Progression, and Mortality. Neurology, Vol. 17. No. 5. 427-442. (1967)
[14] Jobbágy, Á., Furnée, E.H., Krekule, I., Harcos, P., Tárczy, M., Automatic Movement Evaluation for the Early Detection of Parkinsonís Disease Submitted to IEEE/EMBS Magazine (1997)
[15] Jobbágy, Á., Furnée, E.H., Harcos, P., Tárczy, M., Krekule, I., Komjáthi, L., Analysis of Movement Patterns Aids the Early Detection of Parkinsonís Disease Accepted for IEEE/EMBS 19th Ann. Int. Conf., Chicago, Oct. 30.- Nov. 2. (1997)
[16] van Emmerik, R.E.A. and Wagenaar, R.C., Tremor and symmetry properties in bimanual coordination in Parkinsonís disease. In: Bardy, B.G., Bootsma, R.J. & Guiard, Y. (eds.) Studies in Perception and Action. Lawrence Erlbaum, 61-64. (1995)
[17] Muir, S.R., Jones, R.D., Andreae J.H., Donaldson, I.M., Measurement and Analysis of Single and Multiple Finger Tapping in Normal and Parkinsonian Subjects. Parkinsonism & Related Disorders, Vol. I. No. 2. 89-96. (1995)
[18] Johnels, B., et al., Measuring motor function in Parkinsonís disease. In Motor Disturbances I, eds. R. Benecke, B. Conrad, C.D. Marsden. Academic Press, 131-144. (1987)